MW
Michael Wrobleski
Answers (4)
MW
Answered
The relationship between samples and populations may be described as ______.
A) researchers collect data from populations in order to test hypotheses about samples
B) researchers calculate descriptive statistics on populations and inferential statistics on samples
C) the larger the sample, the more it resembles the population
D) populations are a subset of samples
A) researchers collect data from populations in order to test hypotheses about samples
B) researchers calculate descriptive statistics on populations and inferential statistics on samples
C) the larger the sample, the more it resembles the population
D) populations are a subset of samples
On Jun 26, 2024
C
MW
Answered
The display shows the heights of Grade 12 students at a local high school,collected so that the students could be arranged with shorter ones in front and taller ones in back for a class photograph.In addition to describing the distribution,give a reason to account for the shape of this distribution. 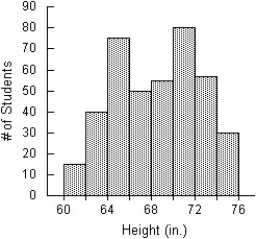
A) The distribution of the heights of Grade 12 students is bimodal,with a mode at around 65 inches and the other mode around 71 inches.The students' heights are between 60 inches and 74 inches.The two modes would likely represent the average heights of the male and female students.
B) The distribution of the heights of Grade 12 students is unimodal centred at 68,with a heights ranging from 60 inches to 76 inches.The two peaks would likely represent the average heights of the male and female students.
C) The distribution of the heights of Grade 12 students is bimodal,with a mode at around 62 inches and the other mode around 74 inches.No student has a height below 60 inches or above 76 inches.The two modes would likely represent the average heights of the male and female students.
D) The distribution of the heights of Grade 12 students is bimodal,with a mode at around 65 inches and the other mode around 71 inches.No student has a height below 60 inches or above 76 inches.The two modes would likely represent the average heights of the male and female students.
E) The distribution of the heights of Grade 12 students is uniform centred at 68,with a heights ranging from 60 inches to 76 inches.The two peaks would likely represent the average heights of the male and female students.
On Jun 23, 2024
D
MW
Answered
Why do we use standard scores?
On May 25, 2024
We use standard scores to be able to compare one distribution to another.
MW
Answered
How long will it take a $1,000 investment to grow to $1500 if it earns 3.8% compounded annually?
On May 22, 2024
10 years, 10 months