PP
Prashant Porwal
Answers (2)
PP
Answered
An experiment involves collecting data about persons or objects by deliberately exposing them to some kind of change and comparing the results.
On Sep 25, 2024
True
PP
Answered
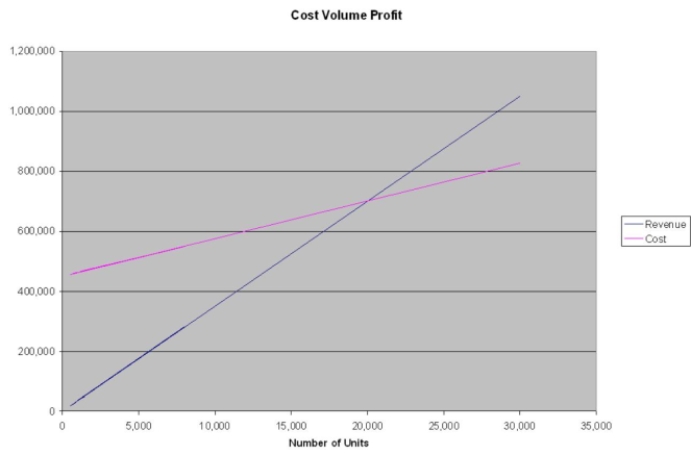
Sam manufactures a product that is selling so well, he has decided to expand his operation to 50,000 units per month. The unit cost is $7, estimated fixed costs are $1.8 mil per year and variable costs are $5 per unit. The product currently sells for $20. Use the graphical approach to CVP analysis to solve the following:
a) What is the break-even point as a percent of capacity?
b) What would the net income be at 75% capacity?
c) What would unit sales have to be to attain a net income of $100,000?
d) If sales dropped to 50% of capacity, what would the resulting net income be?
a) What is the break-even point as a percent of capacity?
b) What would the net income be at 75% capacity?
c) What would unit sales have to be to attain a net income of $100,000?
d) If sales dropped to 50% of capacity, what would the resulting net income be?
On Sep 22, 2024
a) approx 37.5%;
b) approx $150,000
c) approx 31,250
d) approx $50,000
b) approx $150,000
c) approx 31,250
d) approx $50,000