VC
Victoria Correia
Answers (5)
VC
Answered
If a simple linear regression model is developed based on a sample where the independent and dependent variables are known to be positively related, then the sign of the slope regression coefficient will be positive also.
On Jun 26, 2024
True
VC
Answered
Solve for the following pair of equations to three figure accuracy
2.9y + 6.8z = 185.8
6.4y + 10.1z = 149.3
2.9y + 6.8z = 185.8
6.4y + 10.1z = 149.3
On Jun 21, 2024
y = -60.53; z = 53.138
VC
Answered
Consider the following hypothesis test:
H0: p .8
.8
Ha: p > .8
A sample of 400 provided a sample proportion of .853.
a.
Determine the standard error of the proportion.
b.
Compute the value of the test statistic.
c.
Determine the p-value; and at a 5% level, test the above hypotheses.
H0: p
.8Ha: p > .8
A sample of 400 provided a sample proportion of .853.
a.
Determine the standard error of the proportion.
b.
Compute the value of the test statistic.
c.
Determine the p-value; and at a 5% level, test the above hypotheses.
On May 25, 2024
a.
.02
b.
z = 2.65
c.
p-value = .004; reject H0
a.
.02
b.
z = 2.65
c.
p-value = .004; reject H0
VC
Answered
The following statistics were calculated based on samples drawn from three normal populations: 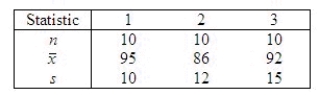 Set up the ANOVA table and test at the 5% level of significance to determine whether differences exist among the population means.
Test statistic = ______________
Critical Value(s) = ______________
Conclusion: ______________
Interpretation:
Differences ______________ exist among the population means.
Set up the ANOVA table and test at the 5% level of significance to determine whether differences exist among the population means.Test statistic = ______________
Critical Value(s) = ______________
Conclusion: ______________
Interpretation:
Differences ______________ exist among the population means.
On May 21, 2024
1.343; 3.35; Do not reject H0; do
VC
Answered
Simplify the complex fraction. (6x2−11x−107x2+7x) (2x−57x+1) \frac { \left( \frac { 6 x ^ { 2 } - 11 x - 10 } { 7 x ^ { 2 } + 7 x } \right) } { \left( \frac { 2 x - 5 } { 7 x + 1 } \right) }(7x+12x−5) (7x2+7x6x2−11x−10)
A) 3x+2x,x≠−52\frac { 3 x + 2 } { x } , x \neq - \frac { 5 } { 2 }x3x+2,x=−25
B) 7(x+1) x(3x+2) ,x≠−52\frac { 7 ( x + 1 ) } { x ( 3 x + 2 ) } , x \neq - \frac { 5 } { 2 }x(3x+2) 7(x+1) ,x=−25
C) (3x+2) (7x+1) 7x(x+1) ,x≠52\frac { ( 3 x + 2 ) ( 7 x + 1 ) } { 7 x ( x + 1 ) } , x \neq \frac { 5 } { 2 }7x(x+1) (3x+2) (7x+1) ,x=25
D) (3x+2) (x+1) x(7x+1) ,x≠52\frac { ( 3 x + 2 ) ( x + 1 ) } { x ( 7 x + 1 ) } , x \neq \frac { 5 } { 2 }x(7x+1) (3x+2) (x+1) ,x=25
E) 7x+17x,x≠52\frac { 7 x + 1 } { 7 x } , x \neq \frac { 5 } { 2 }7x7x+1,x=25
On May 18, 2024
C