Asked by Constance Pettway on May 29, 2024

Verified
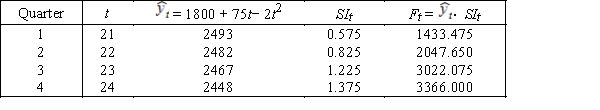
The trend line  = 1800 + 75t− 2t2 and seasonal indexes shown in the table below were computed from five years of quarterly observations.Forecast the four quarterly values for next year.
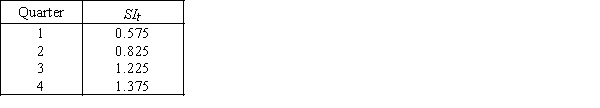
Seasonal Indexes
Factors used to adjust data for seasonality, enabling comparisons across different times of the year by accounting for regular patterns of variation.
Quarterly Observations
Data points or measurements that are collected or reported every three months within a year.
- Investigate the results and forward-looking statements generated by fitting quadratic and linear models to time-series data.

Verified Answer
MS

Learning Objectives
- Investigate the results and forward-looking statements generated by fitting quadratic and linear models to time-series data.