GC
Gretta Clarette
Answers (3)
GC
Answered
Two approaches to drawing a conclusion in a hypothesis test are
A) p-value and critical value.
B) one-tailed and two-tailed.
C) Type I and Type II.
D) null and alternative.
A) p-value and critical value.
B) one-tailed and two-tailed.
C) Type I and Type II.
D) null and alternative.
On May 18, 2024
A
GC
Answered
Blackstone Buildings, Inc. had current liabilities of $450,600; cash of $310,360; accounts receivable of $165,242; and ending inventory of $210,450. Compute its total current assets.
On May 17, 2024
$686,052
GC
Answered
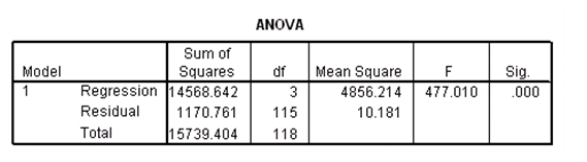
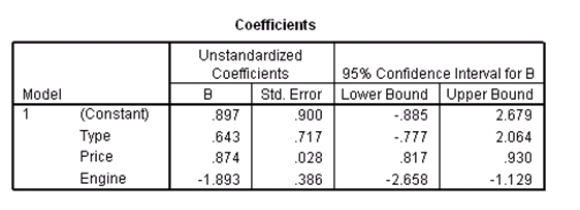
Researchers at a car resale company are trying to build a model to predict a car's 4-year resale value (in thousands of dollars)from several predictor variables.The variables they selected are as below.  Data were collected on cars of different models made by different manufacturers.SPSS output for the least-squares regression model is given below.
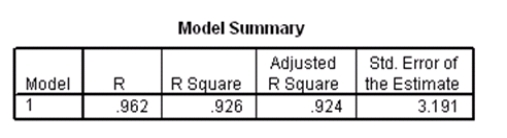
 A Normal quantile plot of the residuals is given below.
 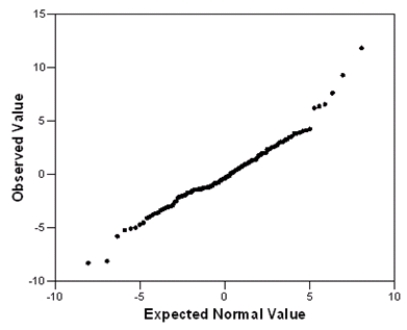 What assumption do we check with this graph,and does the assumption seem to be satisfied?
Data were collected on cars of different models made by different manufacturers.SPSS output for the least-squares regression model is given below. A Normal quantile plot of the residuals is given below. What assumption do we check with this graph,and does the assumption seem to be satisfied?On May 15, 2024
We check the assumption that the error terms are Normally distributed.Since the points in the graph all fall pretty close to a straight line (there may be a few outliers),we may conclude that this assumption seems to be satisfied.