Asked by Johnny Tsunami on May 14, 2024

Verified
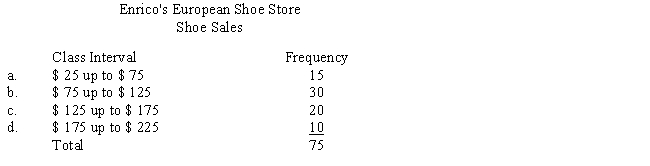
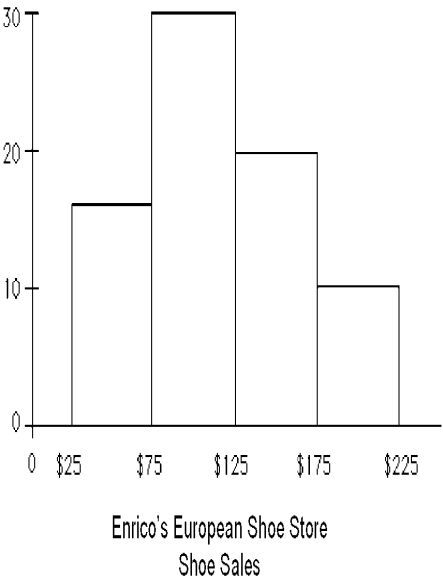
Enrico Vaselli owns Enrico's European Shoe Store, a chain of small stores that sell primarily Italian and French shoes. The operations manager of one store made a frequency distribution of the amounts of 75 randomly selected previous sales, as shown in the following table. Use Figure 24-2 to construct a histogram to display the data.
Histogram
A graphical representation of distributed data using bars of different heights to show the frequency of data points in specific intervals.
Frequency Distribution
A statistical representation showing how often each different value in a set of data occurs.
- Develop visual data representations through the use of histograms.

Verified Answer
TL

Learning Objectives
- Develop visual data representations through the use of histograms.
Related questions
Use Figure 24-3 to Construct a Histogram for the Frequency ...
Use the Frequency Distribution Shown Below and Figure 24-1 to ...
In June, Karen Henderson, an Accountant, Examined Her Records to ...
The Following Table Gives the Total Sales (Revenue)and Profits for ...
Owners of a New Appliances Store Tracked Sales (In Thousands)for ...