Asked by Linda Santos on May 26, 2024

Verified
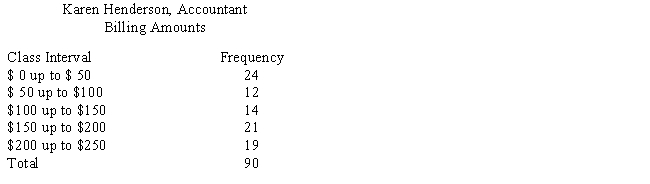
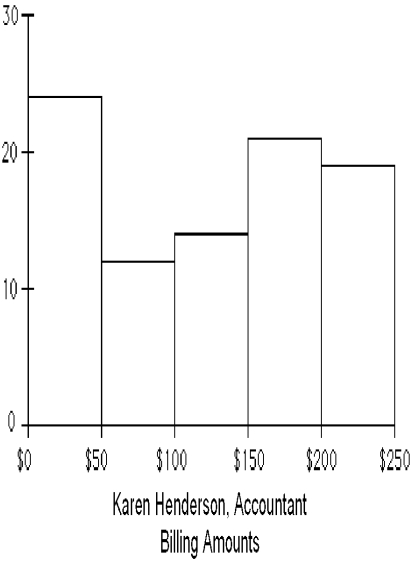
In June, Karen Henderson, an accountant, examined her records to learn the amount she had billed each of the first 90 clients who had contacted her at the beginning of the year for income tax advice. The results of the survey appear in the following table. Use Figure 24-4 to construct a histogram to illustrate this data. Label where necessary.
Histogram
A graphical representation of the distribution of numerical data, using bars of different heights to show frequencies of data within successive intervals.
- Generate visual portrayals of data utilizing histograms.

Verified Answer
ZK

Learning Objectives
- Generate visual portrayals of data utilizing histograms.
Related questions
Use Figure 24-3 to Construct a Histogram for the Frequency ...
Enrico Vaselli Owns Enrico's European Shoe Store, a Chain of ...
Use the Frequency Distribution Shown Below and Figure 24-1 to ...
The Following Table Gives the Total Sales (Revenue)and Profits for ...
Owners of a New Appliances Store Tracked Sales (In Thousands)for ...