Asked by Gurleen Kaur Sidhu on Jun 02, 2024

Verified
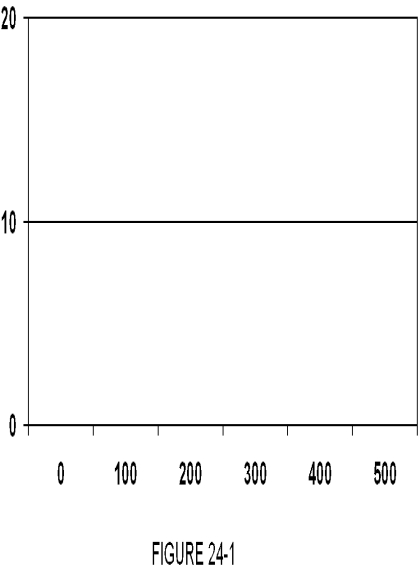
Use the frequency distribution shown below and Figure 24-1 to construct a histogram which displays the data.
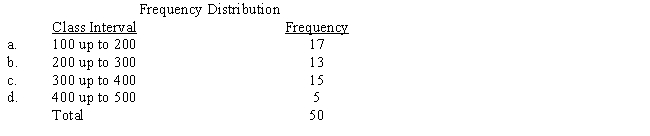
Frequency Distribution
A mathematical function showing the number of instances in which a variable attains each of its possible values.
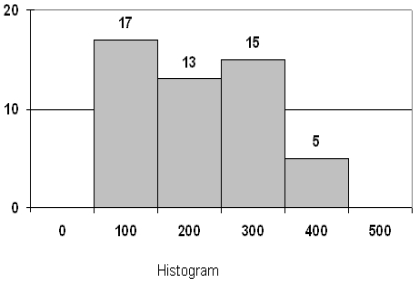
Histogram
A diagram that presents the grouped data from a frequency table.
- Create visual representations of data using histograms.

Verified Answer
AR

Learning Objectives
- Create visual representations of data using histograms.
Related questions
Use Figure 24-3 to Construct a Histogram for the Frequency ...
In June, Karen Henderson, an Accountant, Examined Her Records to ...
Enrico Vaselli Owns Enrico's European Shoe Store, a Chain of ...
Owners of a New Appliances Store Tracked Sales (In Thousands)for ...
The Following Table Gives the Total Sales (Revenue)and Profits for ...