Asked by Andreea Polonic on Jun 19, 2024

Verified
Owners of a new appliances store tracked sales (in thousands)for the first 10 days,and displayed the data in a scatterplot.Make a histogram of the daily sales since the shop has been in business. 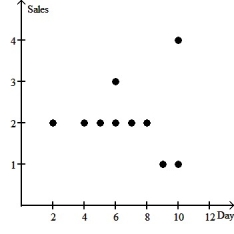
Sales
The transactions of selling goods or services.
Scatterplot
A type of graph used in statistics to display values for two variables for a set of data.
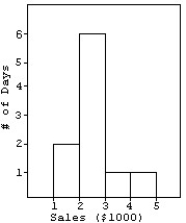
Histogram
A histogram is a graphical representation used in statistics that shows the frequency distribution of a dataset by using bars of different heights or lengths.
- Enhance proficiency in generating and comprehending histograms for the visualization of data.

Verified Answer
MT

Learning Objectives
- Enhance proficiency in generating and comprehending histograms for the visualization of data.
Related questions
The Following Table Gives the Total Sales (Revenue)and Profits for ...
Enrico Vaselli Owns Enrico's European Shoe Store, a Chain of ...
In June, Karen Henderson, an Accountant, Examined Her Records to ...
Use the Frequency Distribution Shown Below and Figure 24-1 to ...
Use Figure 24-3 to Construct a Histogram for the Frequency ...