Asked by Shannon Michaud on May 25, 2024

Verified
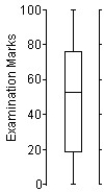
Here is an ogive of the distribution of students' marks on their statistics test. 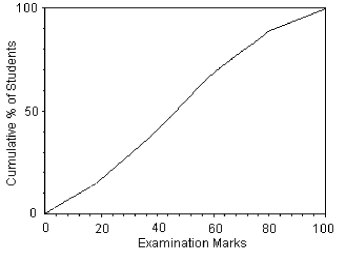 Choose the boxplot that represents the given data.
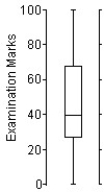
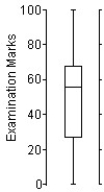
I 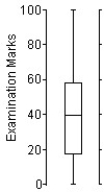
II
III
IV 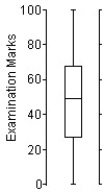
V
A) I
B) II
C) III
D) IV
E) V
Ogive
A graphical representation that displays the cumulative frequencies or cumulative percentages of a dataset, usually in the form of a curve.
Statistics Test
A procedure used to assess the probability of a hypothesis about a data set being true or false.
Boxplot
A graphical representation of data that shows the median, quartiles, and outliers within a dataset, useful for visualizing the distribution.
- Align data sets with suitable graphical displays, including histograms and boxplots.
- Ascertain the significance of quartiles and evaluate the interquartile range presented in boxplots.

Verified Answer

Learning Objectives
- Align data sets with suitable graphical displays, including histograms and boxplots.
- Ascertain the significance of quartiles and evaluate the interquartile range presented in boxplots.
Related questions
Enrico Vaselli Owns Enrico's European Shoe Store, a Chain of ...
Use the Frequency Distribution Shown Below and Figure 24-1 to ...
Use Figure 24-3 to Construct a Histogram for the Frequency ...
In June, Karen Henderson, an Accountant, Examined Her Records to ...
{Weights of Police Officers Narrative} Determine the Location and Value ...